

At Watershed, we're on a mission to help companies measure and reduce their sustainability impacts with precision and confidence. Accurate accounting of greenhouse gas emissions is one step towards this mission—it's the foundation that enables companies to identify reduction opportunities and track progress toward their climate goals.
However, carbon accounting faces a fundamental challenge: measurement variance. Different approaches to measuring the same emissions can yield different results, making it difficult to compare across organizations or track progress consistently over time. This variance is particularly pronounced in Scope 3 emissions calculations.
Scope 3 emissions represent the majority of most companies' carbon footprints, accounting for 44% of total emissions on average, based on CDP 2024 disclosures. Among companies reporting their value chain emissions, 70% rely on "spend-based" methods to calculate these impacts. This approach depends critically on spend classification: the complex task of accurately mapping millions of financial transactions to specific economic sectors. Yet despite its widespread adoption, spend classification remains a bottleneck—challenging to scale, prone to inconsistency, and lacking standardized evaluation methods.
Accurate spend classification requires two critical components: access to high quality emission factors and standardized benchmarks for algorithm comparison.
Watershed addressed the first gap with the recent release of Open CEDA. By making emissions factors openly available, researchers and practitioners can develop and test classification algorithms using the same high-quality environmental data that powers carbon accounting systems globally.
To address the second gap, we developed ATLAS: Aggregate Transaction Ledgers for Accounting Sustainability, a new benchmark dataset. ATLAS facilitates the systematic evaluation and comparison of different approaches, particularly artificial intelligence (AI) models including large language models (LLMs), for the spend classification task in the context of Scope 3 emissions calculation. This work is based on our recently published paper, "ATLAS: A spend classification benchmark for estimating Scope 3 carbon emissions".
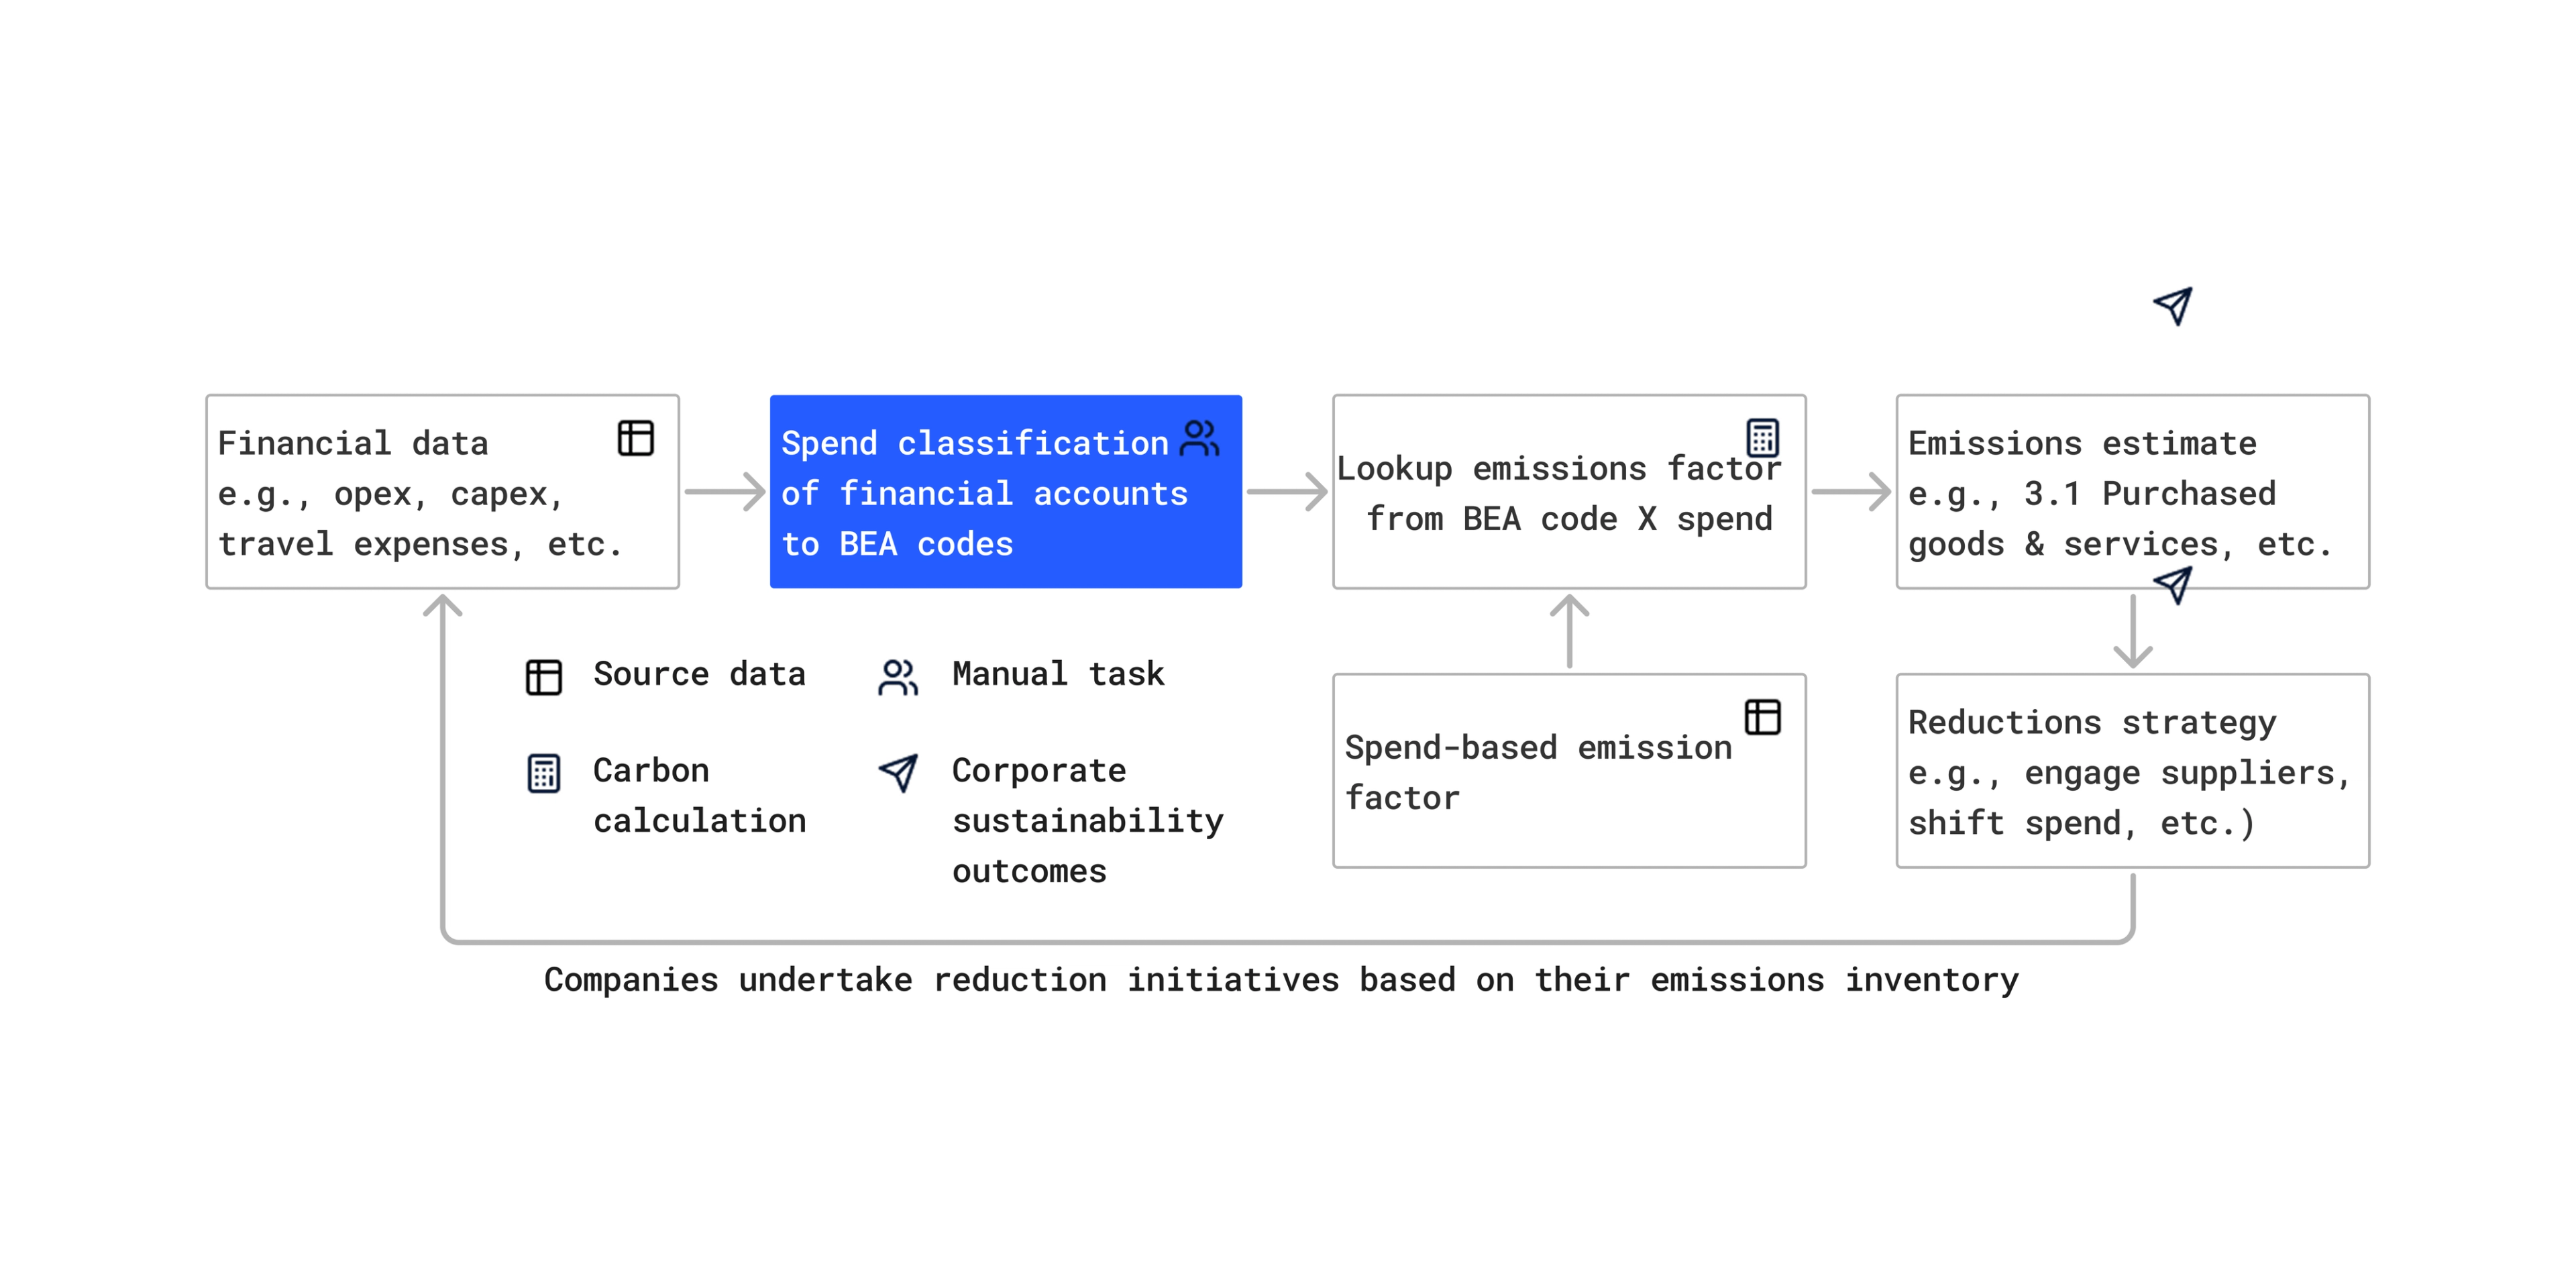
How spend-based Scope 3 estimation works
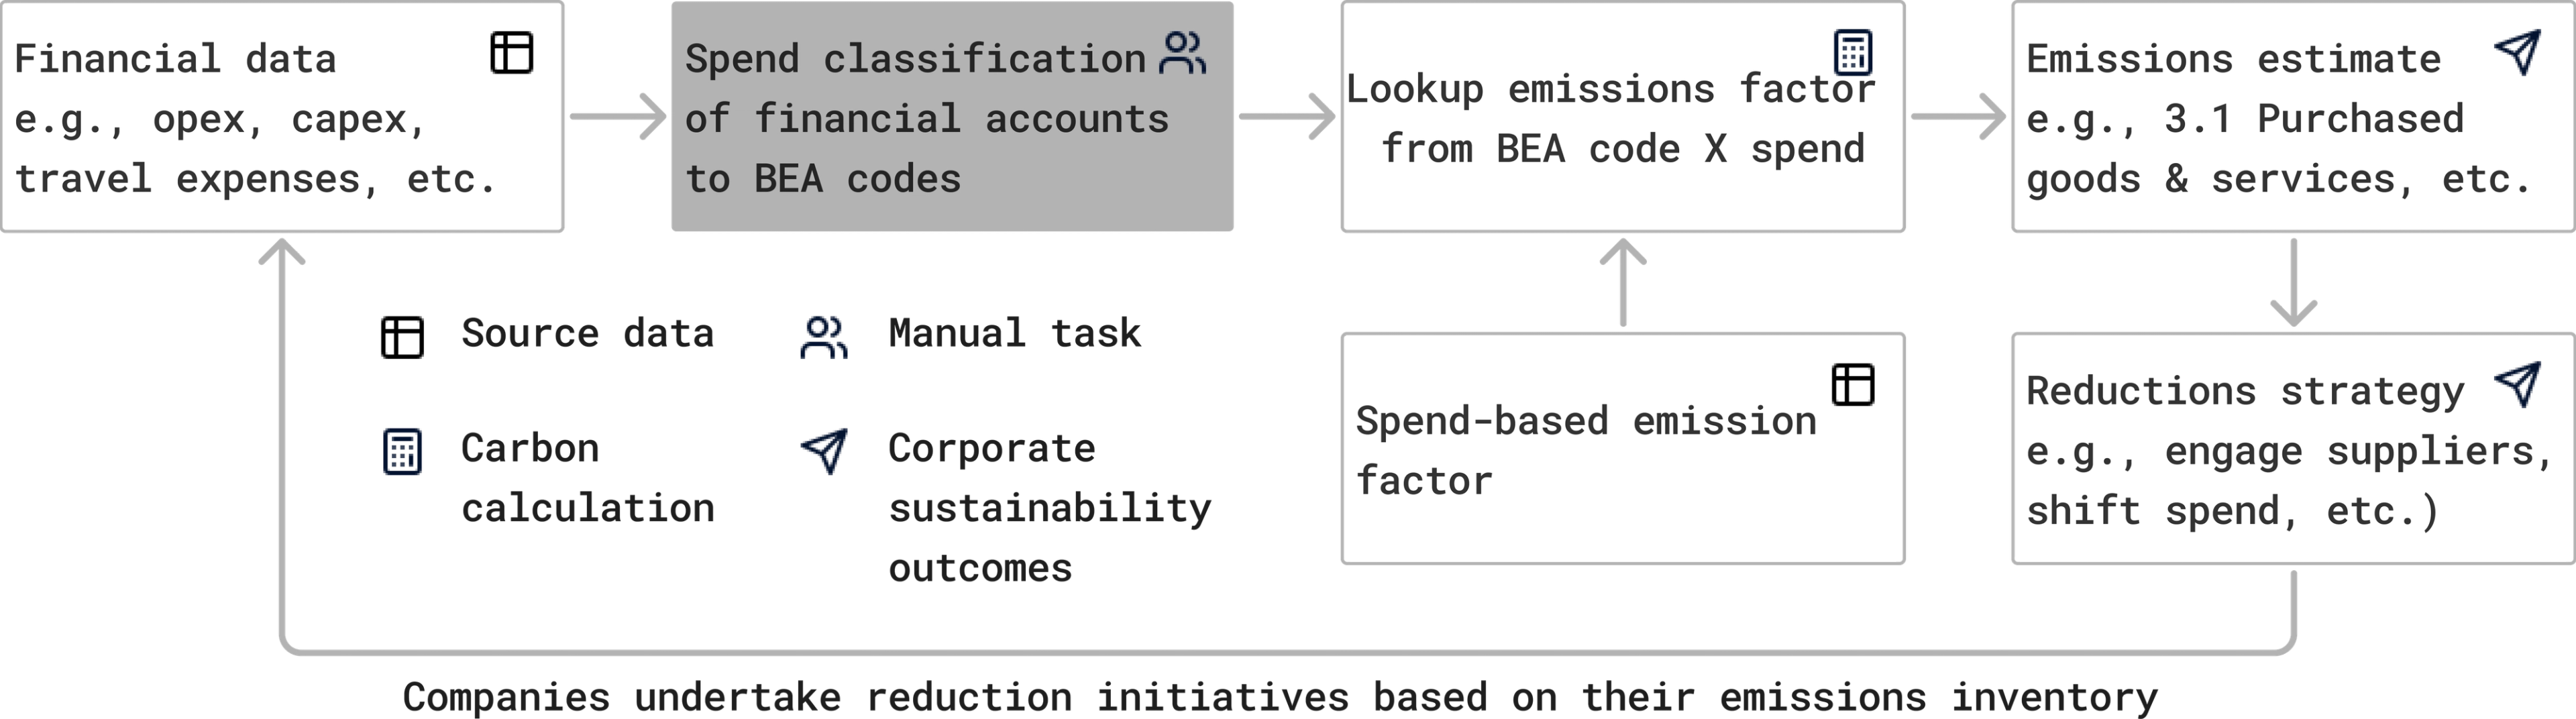
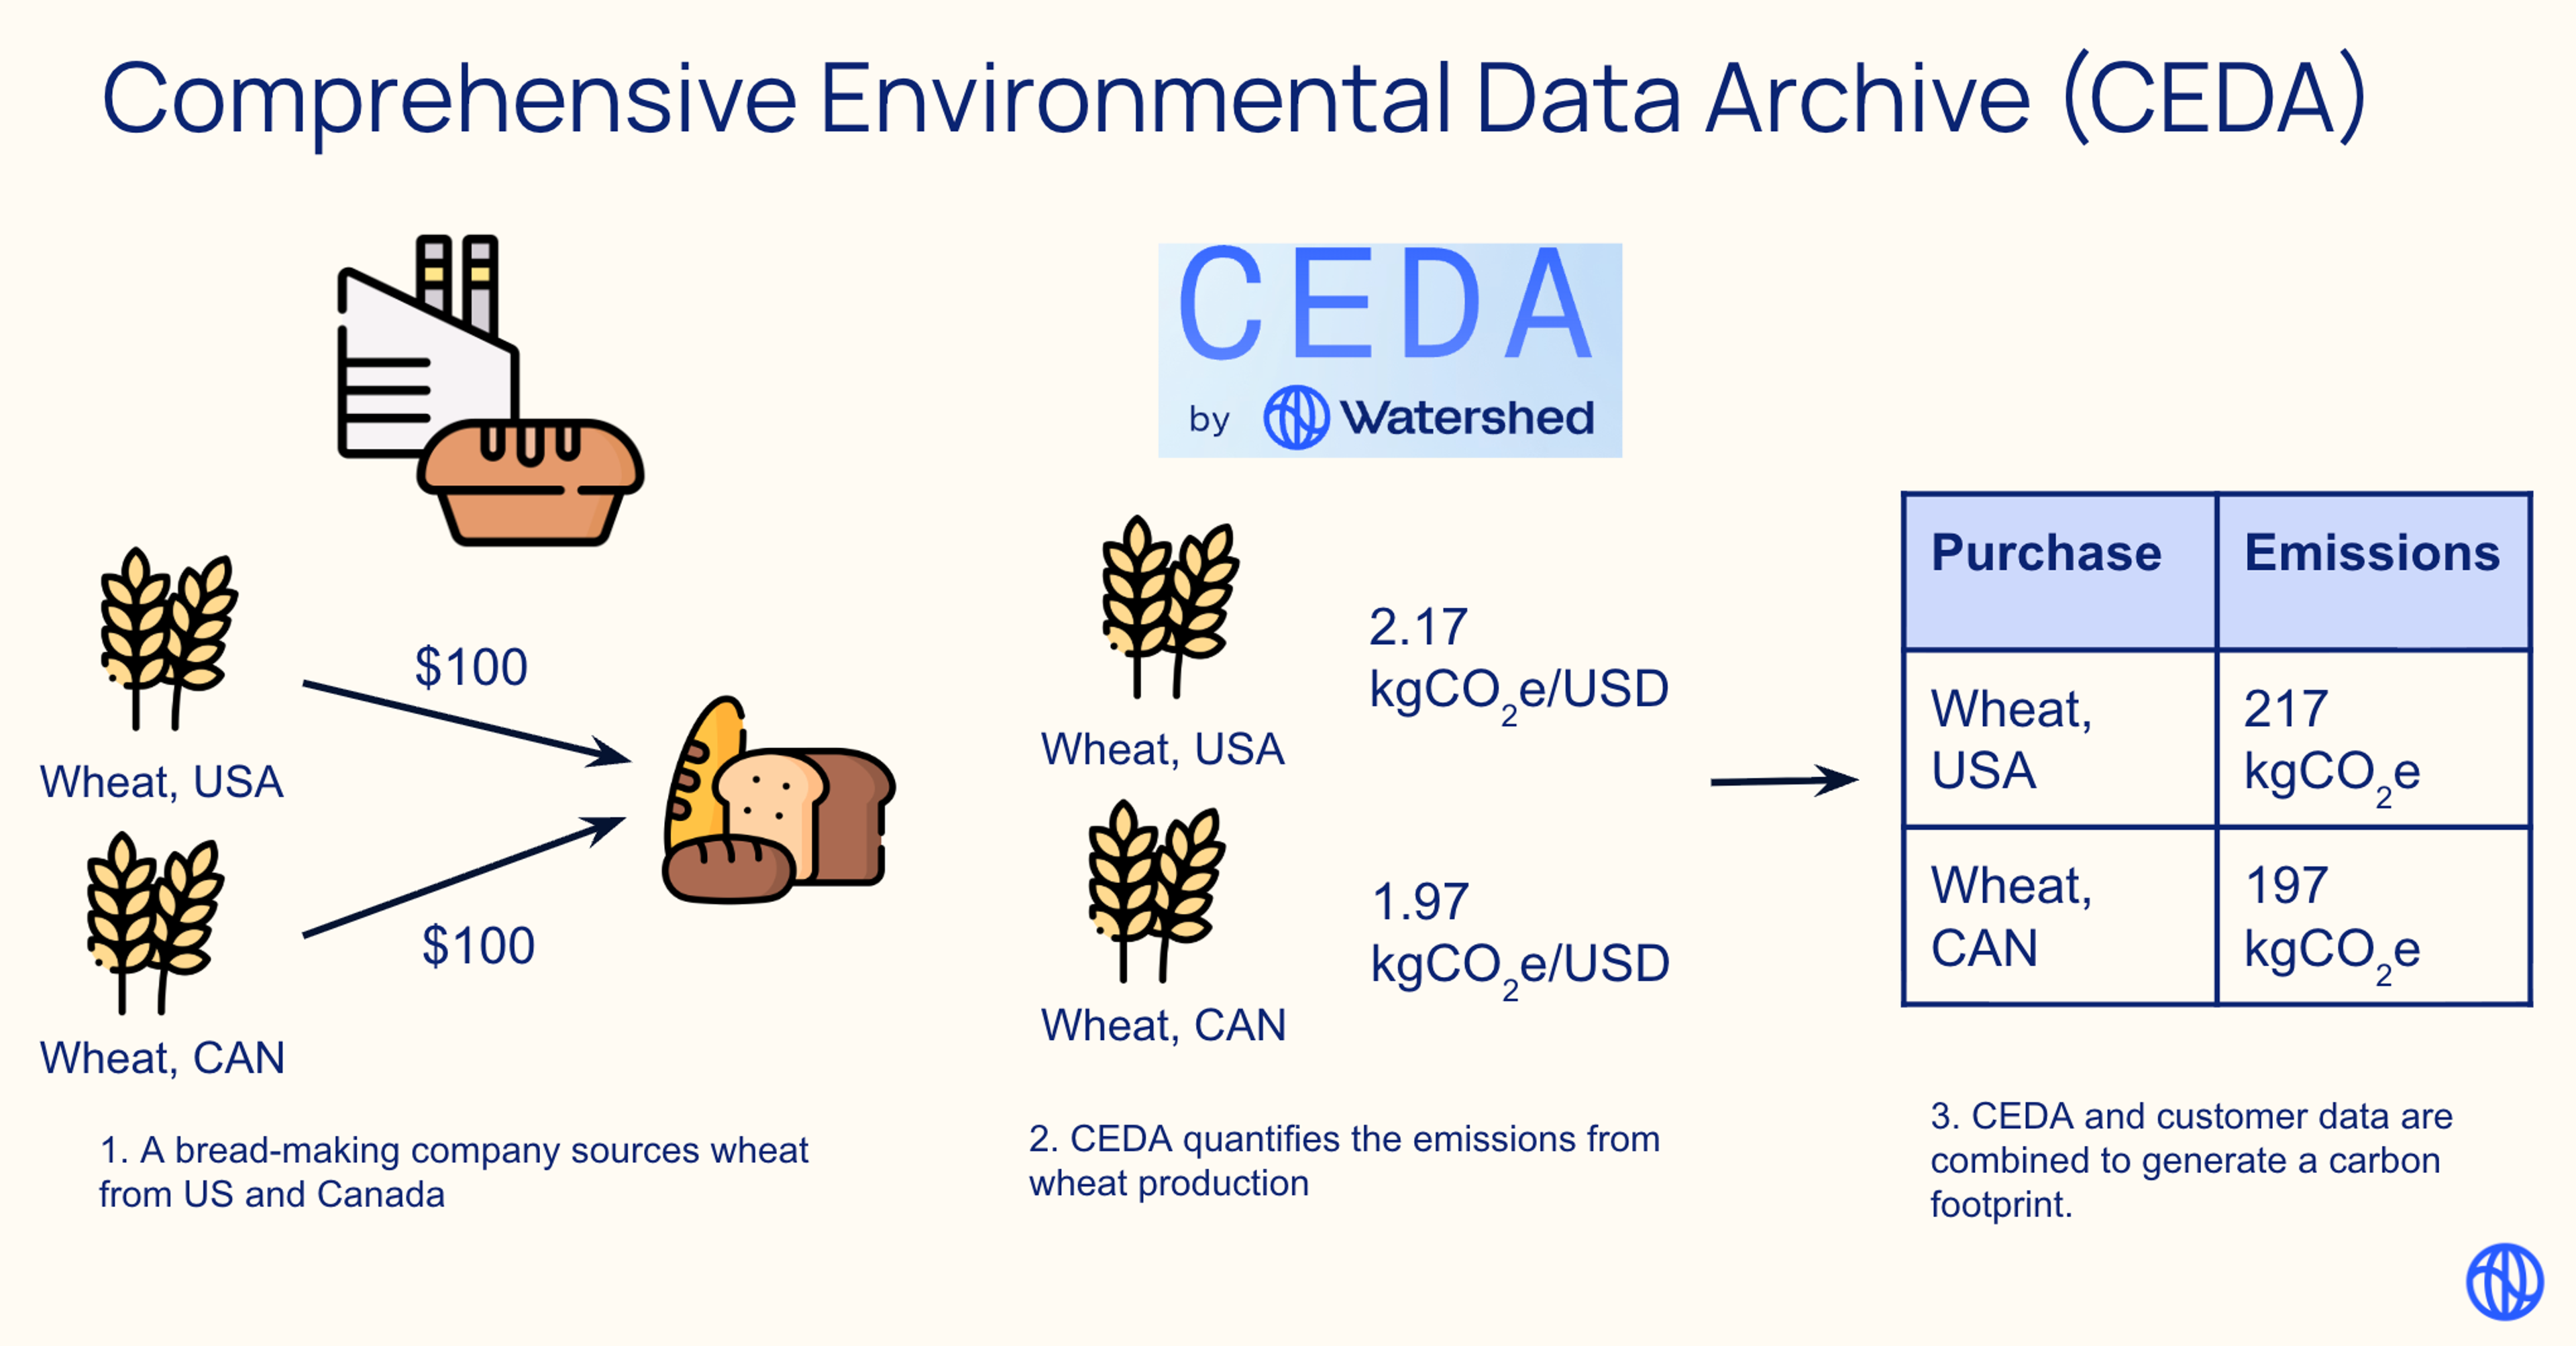
The spend-based method estimates emissions by multiplying the monetary value of purchased goods and services by pre-defined emission factors (kgCO2e per dollar). These EFs are often derived from Environmentally Extended Input-Output (EEIO) models, such as CEDA, which categorize economic activity using schemes like the Bureau of Economic Analysis (BEA) codes.
The core process involves:
- Ingest corporate financial spend ledgers.
- Classify each spend line item (e.g., "Vendor Payment - IT Services", "Acme Corp Raw Materials Purchase") to a corresponding BEA code (e.g., 541519 for Other computer related services, 325100 for Basic chemical manufacturing).
- Apply the appropriate EF associated with the assigned BEA code.
- Aggregate the results to estimate Scope 3 emissions.
For e.g., if a company spends $18 on “salads” that is mapped to BEA code “722211: Limited Services Restaurants”, the associated emissions can be calculated as = 18 ($) * 0.41 (kgCO2e/$) = 7.38 kgCO2e.
Challenges with spend classification
As data scientists at Watershed, we've grappled with this classification challenge firsthand. Working with enterprise customers processing millions of transactions, we quickly realized that manual classification wasn't scalable. We experimented with various automated approaches—from simple keyword lookup to sophisticated AI models—but found ourselves asking: How do we know if our methods are actually improving? How do we compare our approach to other approaches in academic literature? Without a standardized way to evaluate different approaches, we were essentially flying blind.
This challenge stems from several fundamental technical hurdles that make spend classification particularly challenging:
- Scale: Enterprise ledgers contain millions of transactions, making manual classification infeasible.
- Ambiguity: Line item descriptions are often terse, inconsistent, or lack sufficient detail for unambiguous mapping.
- Context dependency: The correct classification can depend on the specific company context or the purpose of the expenditure, which is not always explicit in the description.
- Consistency: Ensuring repeatable classification across different analysts or over time is difficult. Even experts can disagree on the right answer.
- Domain knowledge: Accurate classification requires understanding financial conventions, carbon accounting principles (e.g., identifying non-emissive spend like taxes or salaries), and the structure of EF taxonomies (hundreds of BEA codes).
These challenges collectively demonstrate why automated methods, particularly those leveraging AI and LLMs, represent our best path forward. However, developing these solutions effectively requires standardized evaluation frameworks—meaning consistent datasets, metrics, and testing protocols that allow researchers and practitioners to rigorously compare different approaches, measure incremental improvements, and validate that models perform reliably across diverse scenarios. Without such standards, it's impossible to distinguish genuinely effective methods from those that simply appear to work on limited test cases.
The ATLAS benchmark dataset
ATLAS is a benchmark dataset designed to enable rigorous comparison of spend classification methods for carbon accounting. Following the well-established practice of developing standardized datasets and evaluation protocols for LLM assessment, such as GPQA for question answering or SWEBench for software engineering tasks, ATLAS provides a domain-specific benchmark for carbon accounting applications. It consists of 10,000 synthetic spend line item descriptions with labels covering 295 classes (BEA codes). The spend line items reflect real-world complexity of corporate ledgers, while preserving financial data privacy throughout the process. Our hope is that ATLAS serves as a common benchmark that enables systematic, reproducible evaluation of spend classification algorithms on realistic data.
Dataset specifications:
- Content: 10,000 labelled synthetic spend line item descriptions.
- Labels: Each item is mapped to one of 295 classes: 294 BEA codes relevant to EEIO models, plus a dedicated class for "non-emissive" transactions.
- Generation: Synthesized using Claude 3.5 Sonnet based on BEA sector metadata and distribution patterns observed in a large, private dataset of anonymized corporate spend, covering 9 macro-industries and 8 countries. Naming conventions mimic real-world ledger entries.
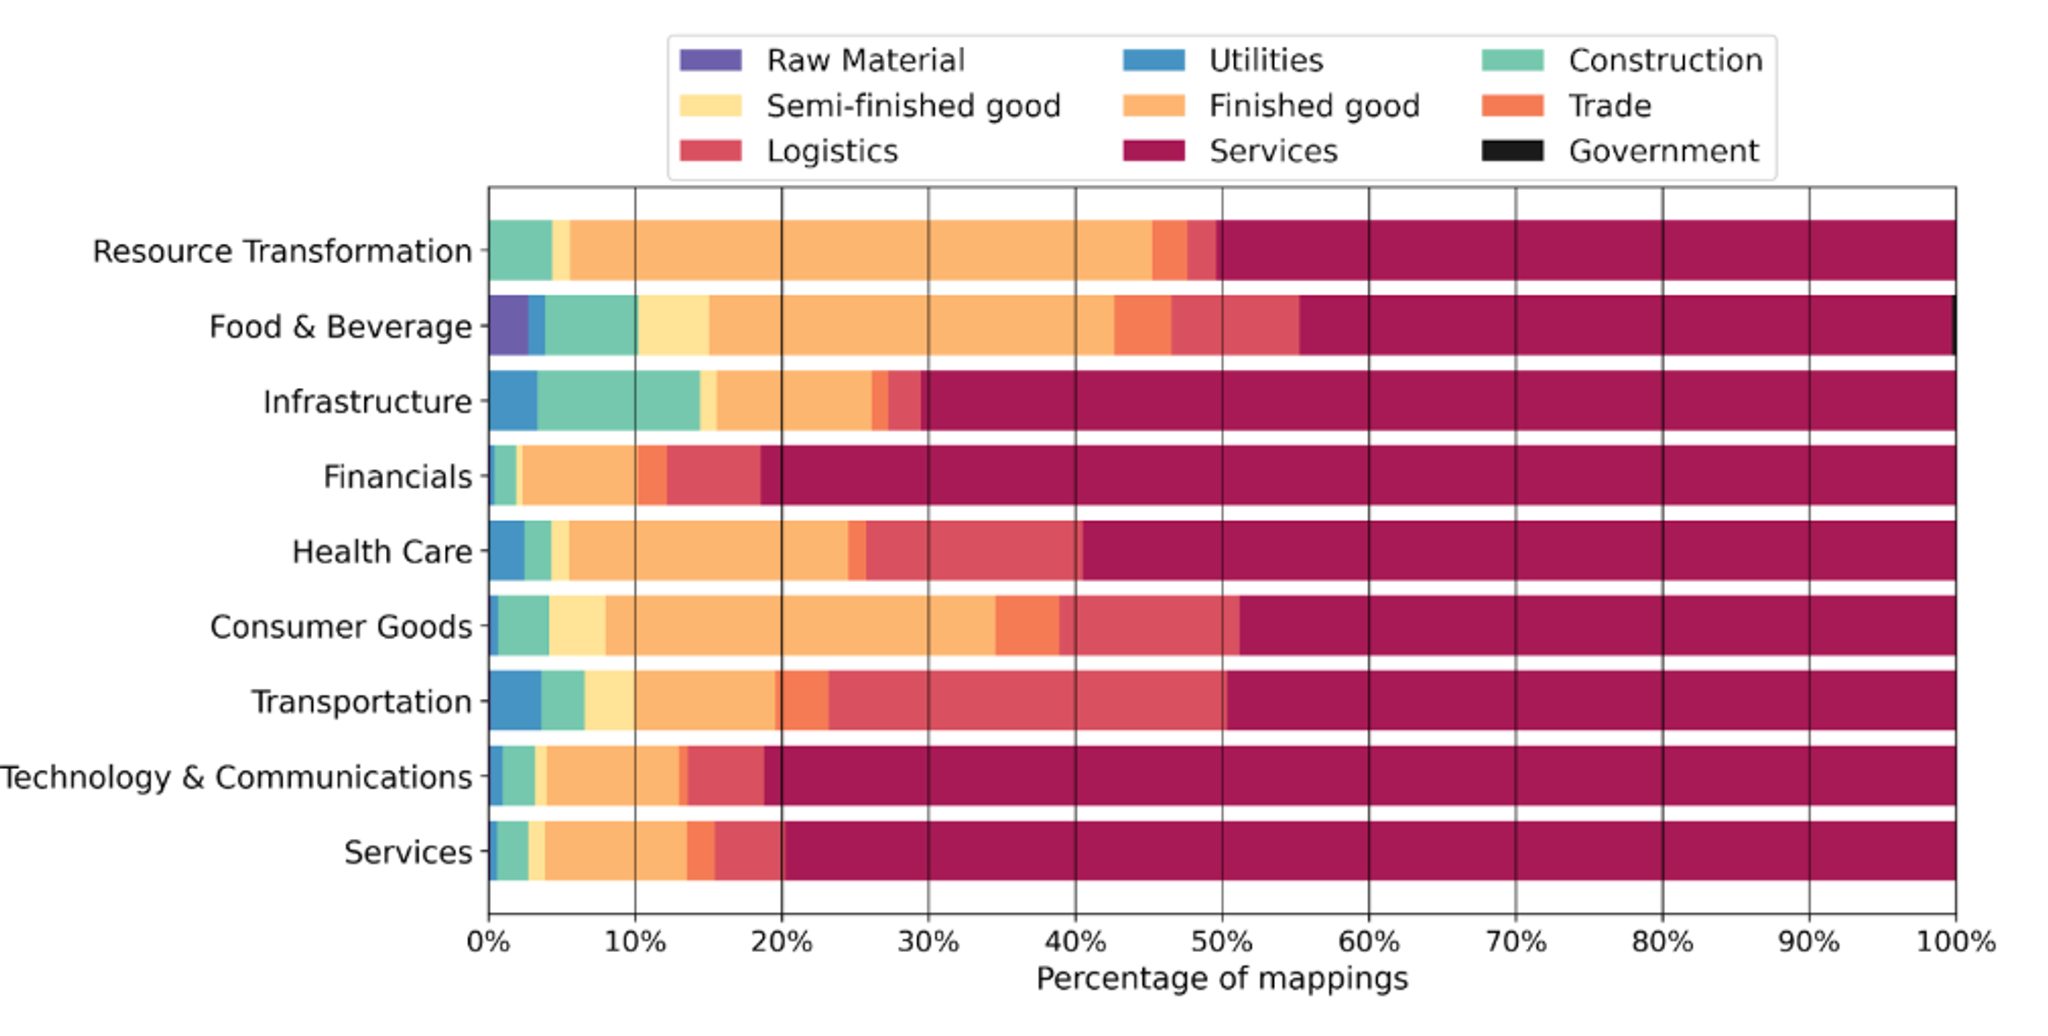
- Diversity: The dataset spans a wide range of economic sectors and positions in the value chain (analyzed using Degree of Fabrication, a measure of how far along a purchased good is in the supply chain, see Figure 2).
These specifications are important because they ensure ATLAS evaluations translate directly to real-world carbon accounting applications. What makes ATLAS particularly valuable is its unique global view. By aggregating and mimicking the expenditure patterns from hundreds of companies across diverse industries and geographies (Figure 2), ATLAS captures a comprehensive view of the modern economy. We performed this global aggregation to create a benchmark that represents the full spectrum of corporate spending behaviors, making it a rich and representative dataset for evaluating spend classification algorithms across practical scenarios. Further, the labels follow the BEA taxonomy, used in the most frequently used EEIO models, making it readily applicable for spend-based accounting.
In summary, ATLAS provides a common ground for evaluating model performance on a task representative of actual spend classification challenges, using labels relevant to established carbon accounting methodologies.
Baseline model performance on ATLAS
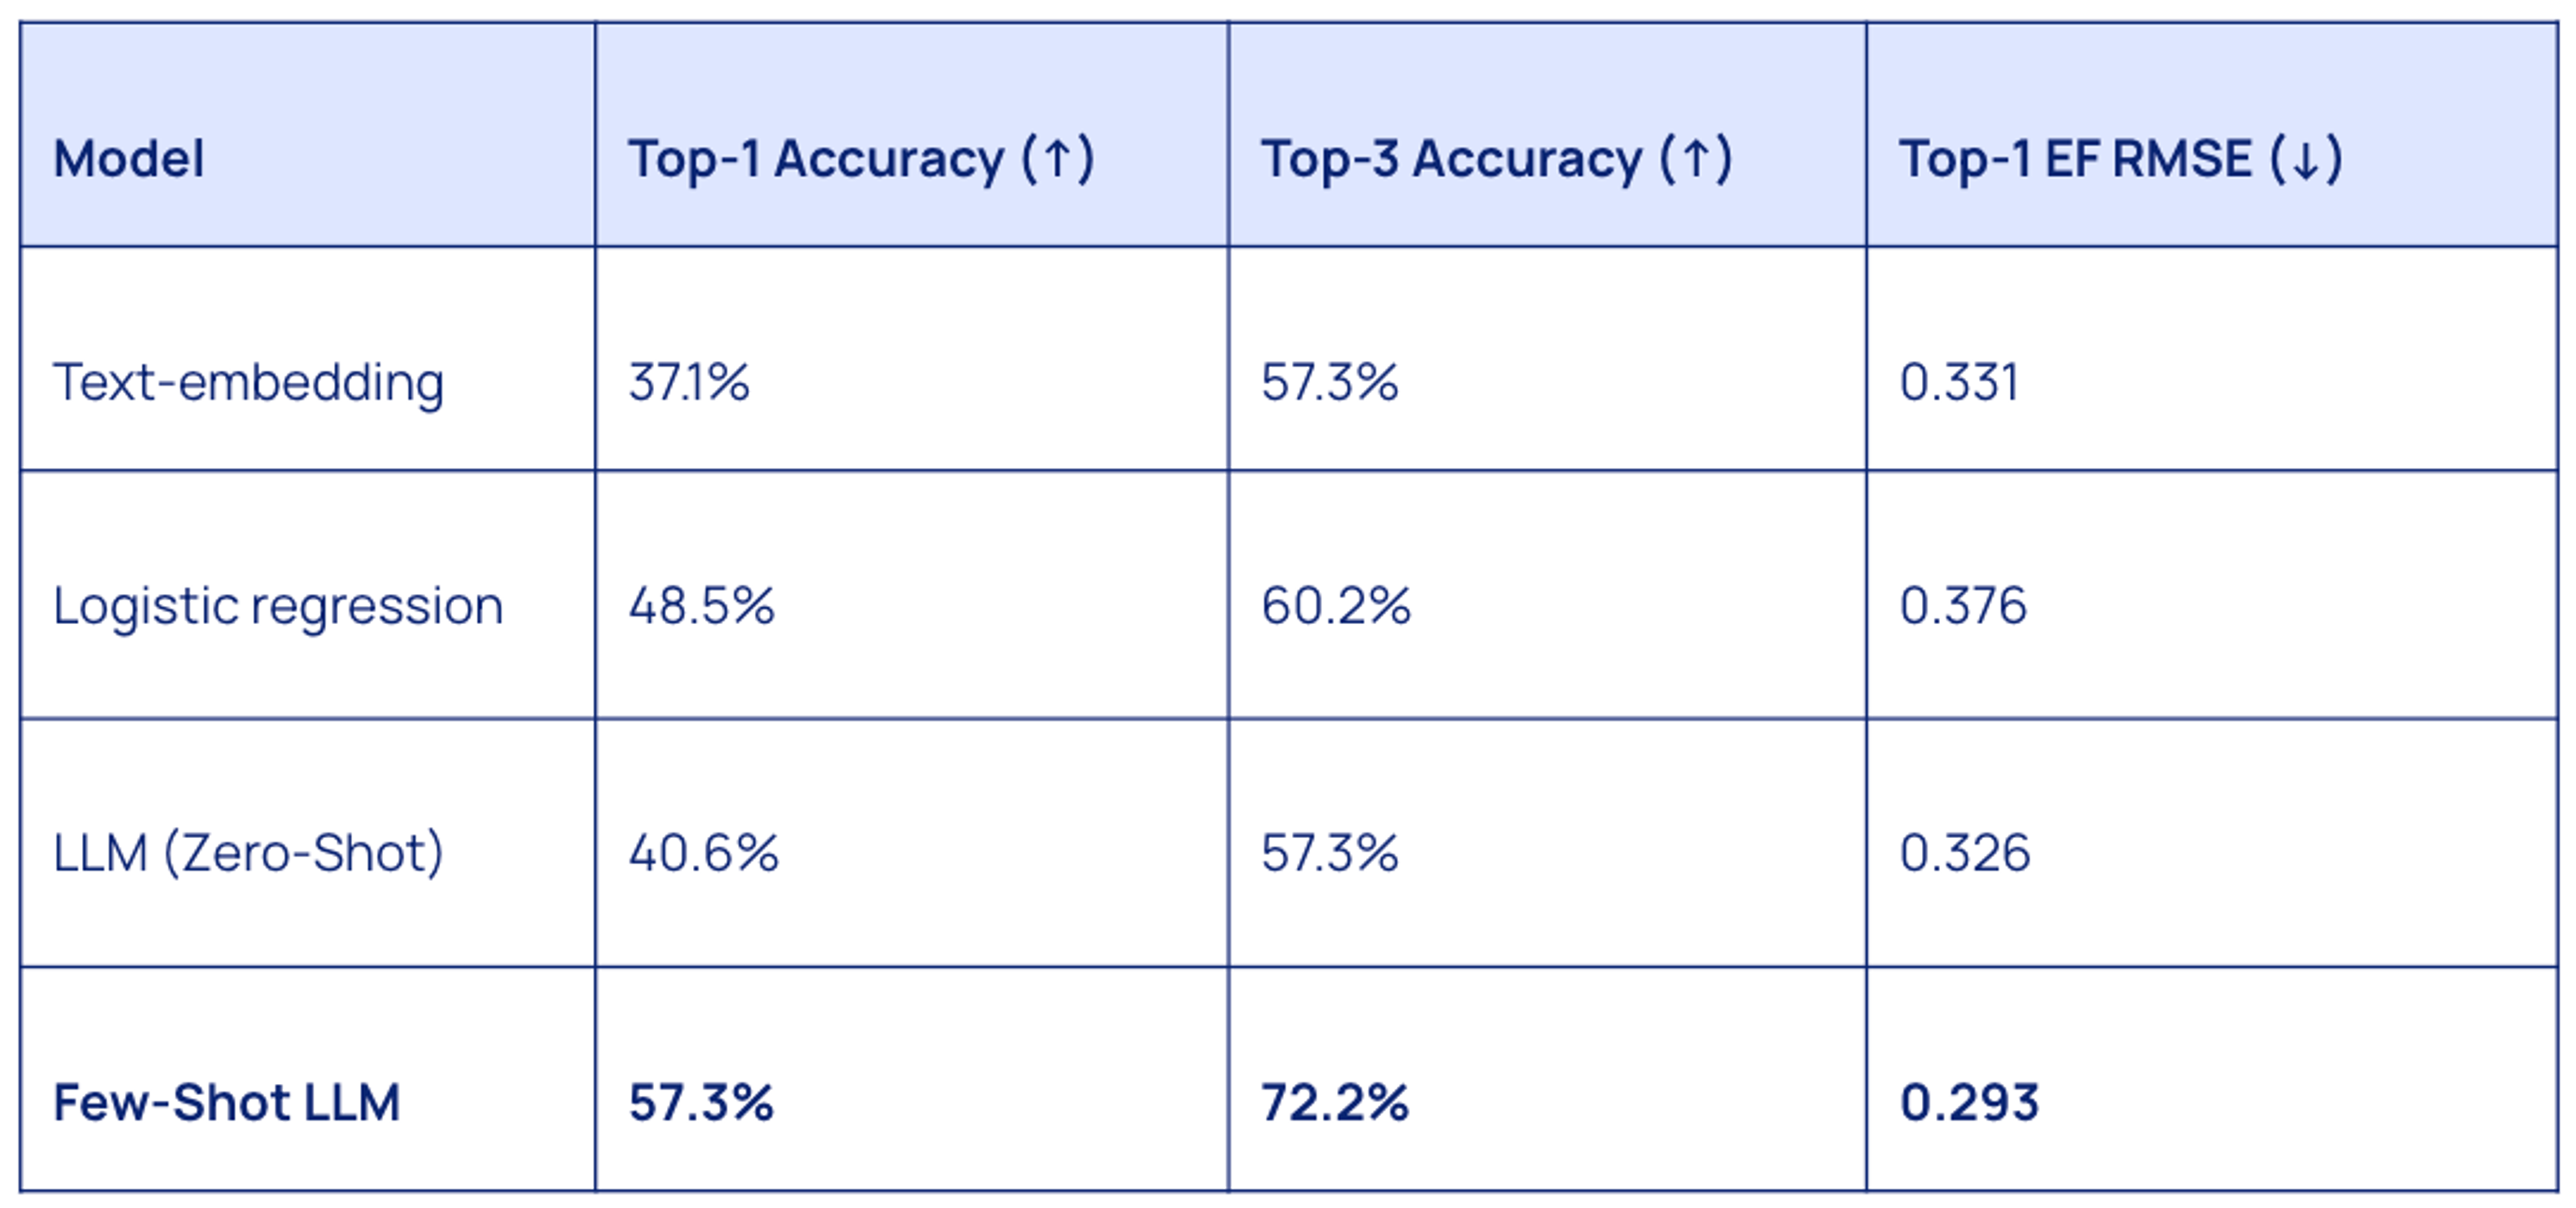
We evaluated four baseline models on ATLAS to establish initial performance metrics:
- Text Embedding Similarity: Cosine similarity between text-embedding-small embeddings of line items and BEA code descriptions/metadata.
- Logistic Regression: Trained on term frequency vectors derived from the line item descriptions.
- LLM (Zero-Shot): Claude 3.5 Sonnet using Chain-of-Thought and Meta-Prompting, without explicit examples.
- LLM (Few-Shot): Claude 3.5 Sonnet augmented with 50 dynamically retrieved examples from a training set provided via in-context learning.
The initial results on ATLAS reveal several key insights for data scientists and sustainability analysts working on spend-based Scope 3 solutions.
First, context matters tremendously. The Few-Shot LLM approach outperformed all other methods by a substantial margin, achieving 57.3% top-1 accuracy compared to just 40.6% for the same model without examples. This 16.7 percentage point improvement demonstrates how critical relevant examples are for this specialized classification task. For practitioners, this suggests that maintaining a curated set of high-quality, previously classified examples could significantly enhance model performance.
Second, the gap between top-1 and top-3 accuracy highlights an immediate practical application. While fully automated classification isn't yet reliable enough for critical sustainability reporting, a human-in-the-loop system where AI suggests the top three most likely classifications with 72% precision could already boost productivity. This represents a sweet spot between automation and accuracy that organizations could implement today.
Finally, the RMSE metrics reveal that we're still some way from perfect automation. An error of 0.293 in emissions factors can represent significant miscalculations in absolute emissions when dealing with large expenditures. This underscores the continued importance of the need for a benchmark like ATLAS to help train and evaluate state-of-the-art models.
Building toward better sustainability reporting
The ATLAS benchmark represents a crucial step toward more reliable, efficient Scope 3 emissions estimation – but it's just the beginning. At Watershed, we're exploring several technical approaches to improve automated spend classification:
- Specialized prompt engineering: Developing domain-specific prompting strategies that incorporate carbon accounting principles and financial terminology could boost performance without requiring model retraining.
- Retrieval-augmented generation: More sophisticated retrieval mechanisms could improve few-shot learning by dynamically selecting the most relevant examples for each transaction.
- Multimodal approaches: Incorporating structured data beyond text descriptions, like vendor information, account hierarchies, or historical classifications, could provide additional signals for better classification.
- Fine-tuning for sustainability: Creating specialized models fine-tuned on financial-to-carbon mapping tasks could outperform general-purpose LLMs, even with fewer parameters.
By establishing a common evaluation framework, we hope ATLAS accelerates the development of tools that improve the efficiency, reliability, and scalability of spend-based carbon accounting. The end goal isn't just better measurement – it's enabling the rapid emissions reductions needed across global supply chains to meet our collective sustainability goals.
Dataset Access: The ATLAS dataset is available for academic research purposes upon request to the corresponding authors listed in the original paper.
Reference: A. Dumit, K. Rao, T. Kwee, J. Glidden, V. Gopalakrishnan, K. Tsai, S. Suh. ATLAS: A spend classification benchmark for estimating scope 3 carbon emissions. Tackling Climate Change with Machine Learning Workshop at NeurIPS 2024.